

How Accurate Are School's Claims in Feldman's Freaks List?
James Foster was tired of getting run amok, led a stray and flat out deceived by school's athletic testing claims, so he decided to see who should can be trusted.

Since 2005, The Athletic’s Bruce Feldman has collected workout numbers and tracking data from college football teams across the country, highlighting the most impressive athletes in his annual article, “Feldman’s Freaks List.” It’s a valuable resource, and the most anticipated article of the year for draftniks and college football fans.
The most attention-grabbing information in Feldman’s piece is the school-reported workout results. These unverified numbers are typically recorded a year before the player performs the drill at the combine, so it’s important to take them with a grain of salt.
I’ve been fooled in the past by players like Mazi Smith, whose actual combine results were a letdown relative to the numbers Michigan invented for him, so I now make sure to read the Freaks List with healthy skepticism. But I’ve always wondered how skeptical I should be of these claims, and whether the accuracy varies by drill, team or conference.
For this article, I evaluated every Freaks List claim from 2018 to 2024 and analyzed the results by school, drill, conference, year and other factors to determine how each factor affects accuracy. This data provides insight into whether a claim should be trusted, questioned or ignored, and allows for a more critical analysis of the Freaks List.
METHODOLOGY
My first step was creating a list of claims from each article. I define a “claim” as a reported drill result that can be verified at the combine.
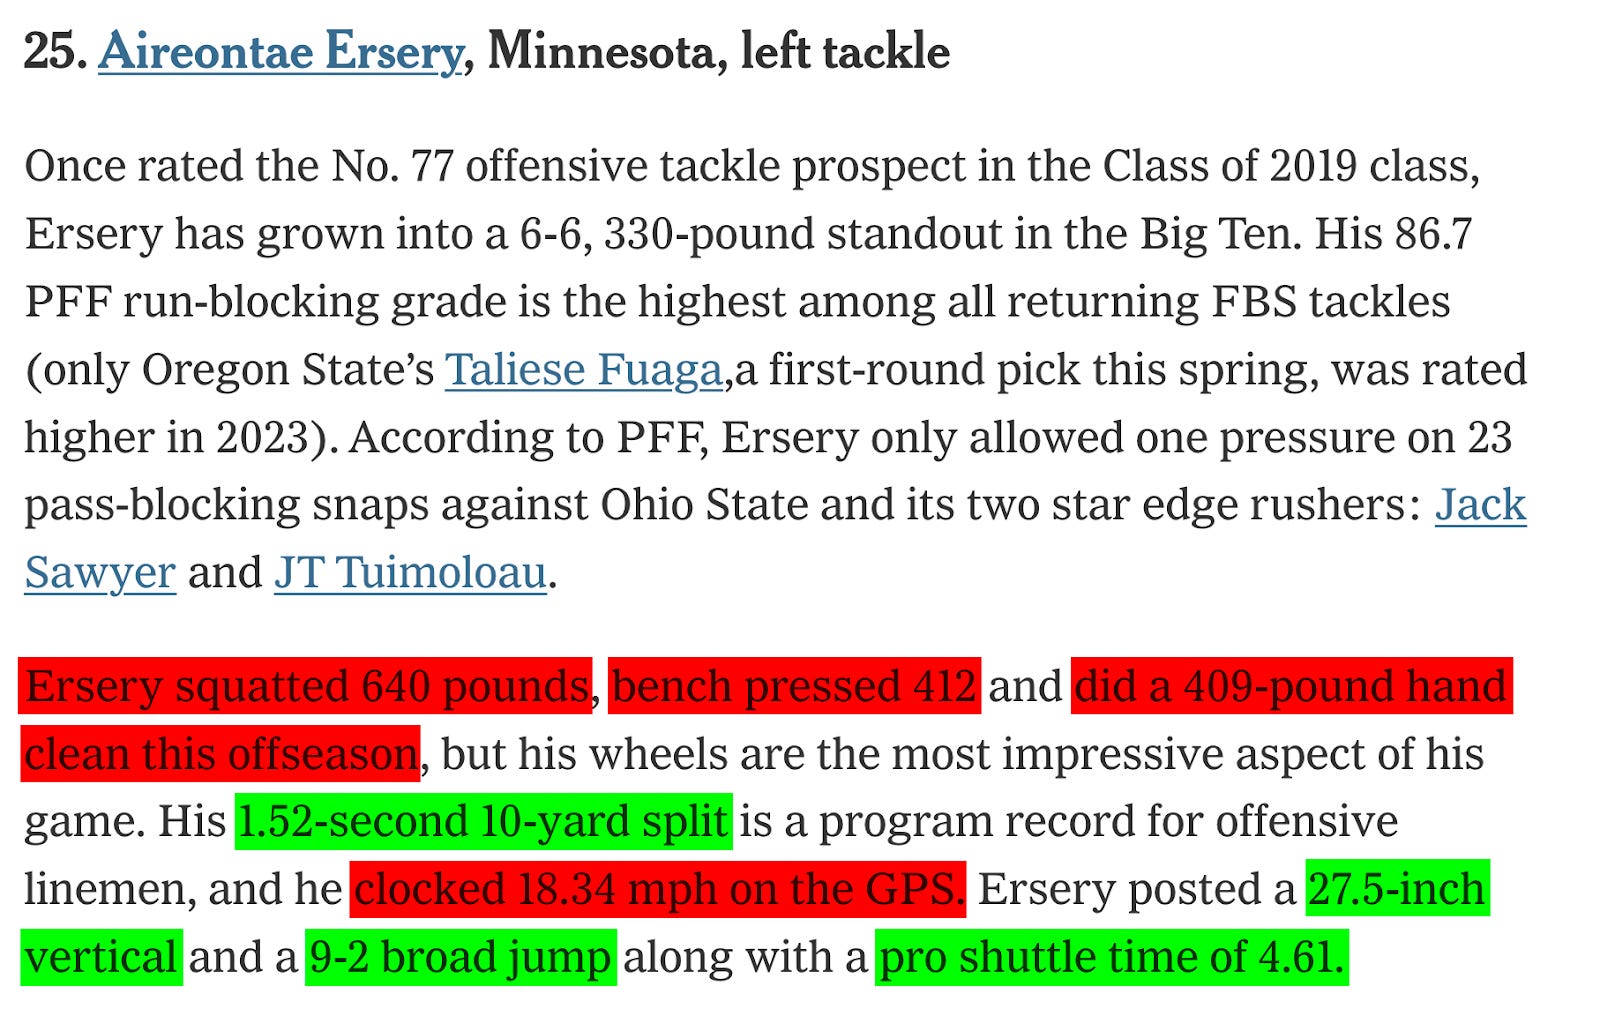
Looking at Aireontae Ersery’s 2024 blurb, for example, the statements highlighted in green all qualify as claims, while those in red do not. Any reported tracking data or weight-room feats (aside from 225 bench press reps) cannot be verified and aren’t considered “claims.”
I compare the reported numbers to the combine and pro day results (best of the two) and give each claim a score of 0 or 1 depending on accuracy.
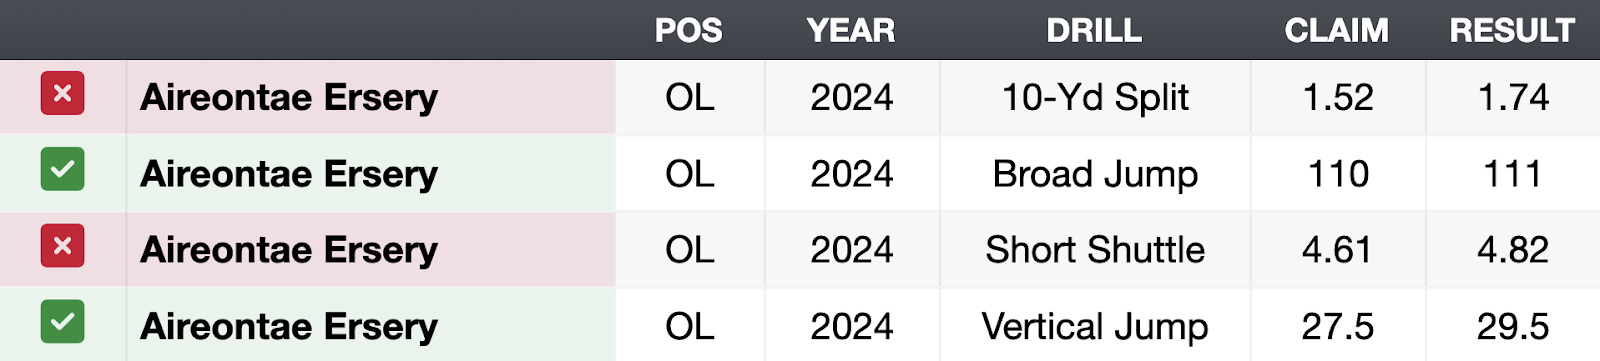
Ersery’s broad (111/110) and vertical (29.5/27.5) jumps were higher than reported, so he gets full credit (1) for those claims. But his 10-yard split (1.74/1.52) and short shuttle (4.82/4.61) were worse, so those count as misses (0).
I then calculate the raw accuracy rate for each player, school and conference by averaging the scores. This process is straightforward for a player like Ersery, whose incorrect claims were all decisive misses.
His reported 10-yard split and short shuttle would have ranked in the 100th and 78th percentiles for offensive tackles, but his actual results ranked in the 78th and 39th percentiles.
But the Freaks List is ultimately designed to serve as a watchlist of elite athletes, not a cheat sheet for NFL Combine prop bets, so the accuracy rate calculation should be a bit more flexible and less punitive. While the binary scoring system provides a rough estimate, it doesn’t account for the severity of missed claims.
A player with a reported 4.35 40-time running a 4.55 at the combine would qualify as a miss and receive no credit. If that player ran a 4.36, however, the claim would still be scored as a miss, which, under a binary grading system, would have the same score (0) and the same negative impact on the overall accuracy rate.
However, a 0.01-second difference is negligible and could be attributed to an inefficient start, a false step or a slight weight change. Nobody who read and believed this player’s reported 4.35 40-time was disappointed when he ran a 4.36. For this study, that claim is fairly accurate and shouldn’t be classified as a “miss” to the same extent as a 0.2-second exaggeration.
To address this issue, I created an adjusted accuracy rate, which grades close misses and egregious whiffs differently. As with the raw accuracy rate, a player gets a 1 when they perform at or better than the reported number. Missed claims receive a score of 0.75, 0.5, 0.25 or 0, depending on how close the result is to the reported number.
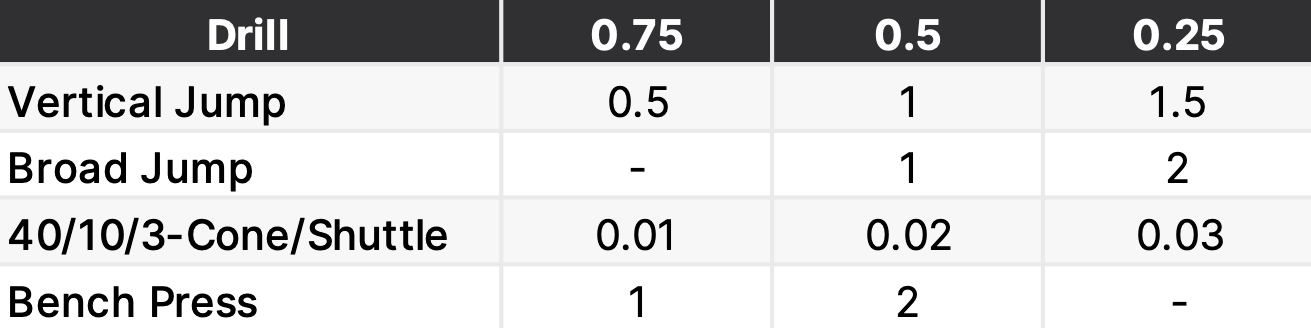
The table above shows how much partial credit a claim receives based on the drill and severity of the miss. For example, if a player’s actual vertical jump is within 0.5 inches of the reported number, the score for that claim is 0.75. Misses of 1.0 and 1.5 inches are scored 0.5 and 0.25, respectively.
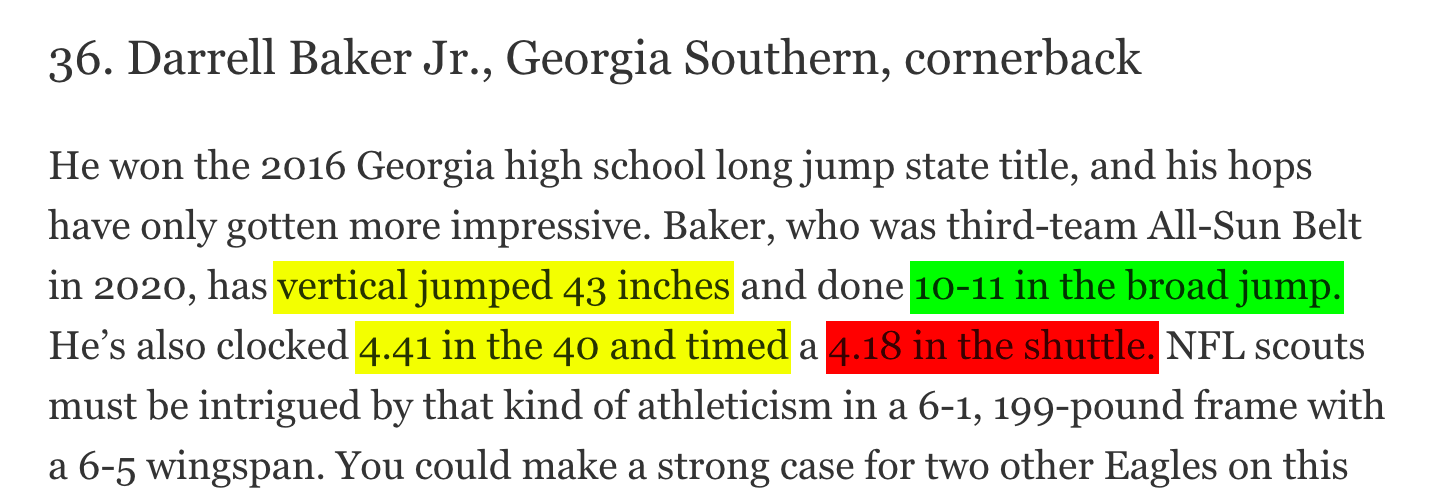
Darrell Baker Jr.’s section in the 2021 Freaks List exemplifies the value of adjusted accuracy. He exceeded expectations in the broad jump, which was five inches better than reported, but fell short on the other three claims.
In the binary grading system, Baker Jr. is credited with one correct claim and three misses, for a raw accuracy of 25% (1/4).
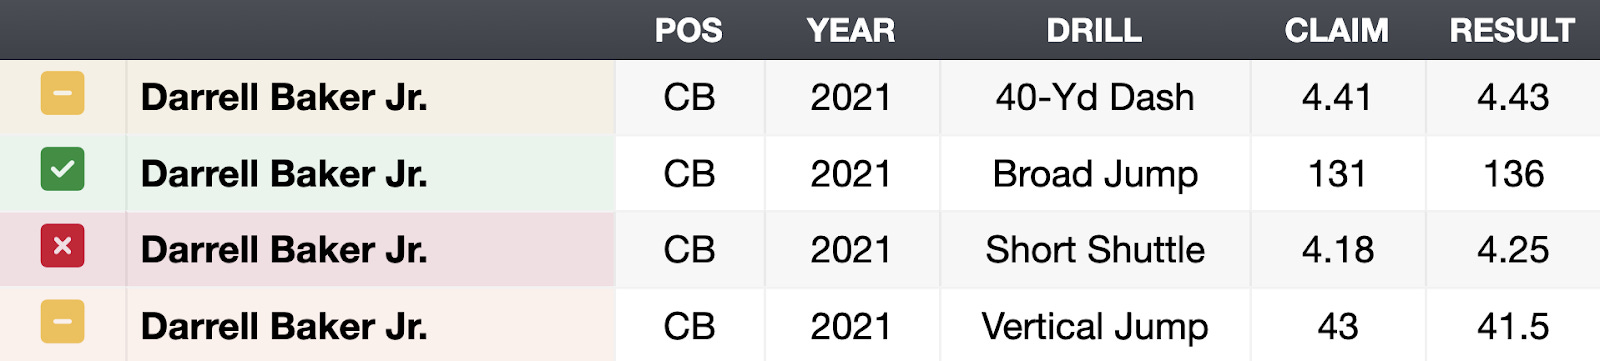
The adjusted approach still penalizes him for the short shuttle (0.07 difference) but gives partial credit for close misses. His 40-time was just 0.02 seconds slower than reported, which corresponds to a 0.5. He also gets a 0.25 for the vertical jump since the actual result was within 1.5 inches of the claim.
Baker Jr.’s adjusted accuracy = (1 + 0.5 + 0.25 + 0) / 4 = 43.8%.

 |
|