Minnesota Vikings' Jonathan Greenard Decision Reveals How Weird Analytics Are
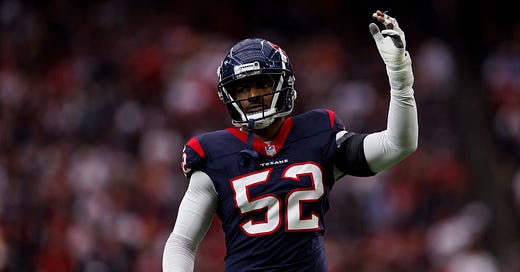
The Vikings and Texans functionally swapped Jonathan Greenard and Danielle Hunter. Who does the data say is better? Depends on who you ask. And how.
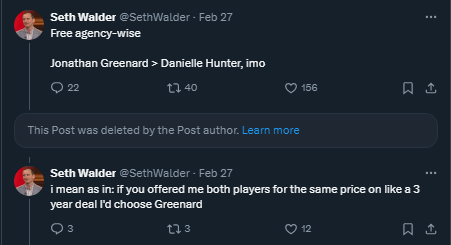
When the Vikings signed Jonathan Greenard to functionally replace Danielle Hunter, there was a small bit of discussion about what Seth Walder, a statistician with ESPN Sports & Info, said in February – especially after it was revealed that the Texans signed Hunter to replace Greenard.
In ESPN’s 2023 data, Greenard has a much higher pass rush win rate than Hunter and ranked sixth in the metric. Hunter ranked approximately 33rd out of 51 qualifying players. Sheil Kapadia, who is very familiar with analytics, placed Greenard ahead of Hunter in the Ringer’s free agency rankings.
Not everyone who writes with an analytical bent followed suit; Bill Barnwell placed Hunter in a tier ahead of Greenard in his free agency rankings, but it was otherwise a pretty well-understood take that the analytics community liked Greenard more than Hunter.
Except, hold on.
Pro Football Focus ranked Hunter ahead of Greenard. We should be careful not to conflate PFF with analytics – they are, primarily, a film charting company that happens to produce data. Their analytics work has been a side hustle, one that’s gotten smaller since the exodus of some of their analytics staffers to places like Sumer Sports.
That said, their grades are part of the conversation and one would largely expect their free agency rankings to correlate somewhat strongly with the rankings of those who use analytics regularly in their work.
Nevertheless, because of their proximity – essentially a player swap between the Vikings and Texans – it makes sense to look at what the data says about both Greenard and Hunter to get a good understanding of what’s going on. But not with the edge rushers – with the data.
The Data Disagrees
Greenard won’t be good or bad “because” of the data. Measurements are proxy tools to determine if there is an effect – and sometimes measures are incomplete. Measurements are rarely “wrong” but people who interpret them often can be.
In order to get a good sense of the data, comparing how players did across different datasets can be useful. But there’s a problem – not all data measure the same events.
Comparing disparate sets of data, even if they purport to measure the same thing, can be frustrating. The first frustration in this instance came from how the data was logged. In ESPN’s data, Greenard is noted as having 241 “plays,” but Pro Football Focus notes that he rushed the passer 440 times. When eliminating any snaps where Greenard rushed the passer from the interior, he’s still left with 336 pass rushes in PFF’s data.
When eliminating plays where Greenard lined up even further outside than the outside shoulder of a real or hypothetical tight end, then we have something close – 289 pass-rushing snaps. Finally, we can eliminate plays with screens, bringing Greenard’s pass rush total to 252 in PFF’s data and 241 in ESPN’s.
Even with this method, there are fairly variable discrepancies in pass-rushing snaps across pass-rushers. For example, Bryce Huff has a pretty similar total across the two services with 209 from ESPN and 202 from PFF.
But Trey Hendrickson sees a nearly 70-snap difference, with 264 from ESPN and 330 from PFF. The discrepancy has little to do with double-team rates or play-action rates, either. Players with high rates of double-teamed snaps, like Micah Parsons and Myles Garrett have far different snap counts across the two services.
Keep reading with a 7-day free trial
Subscribe to Wide Left to keep reading this post and get 7 days of free access to the full post archives.


