Ranking the Supporting Casts: How Much Did Joshua Dobbs Benefit From Switching Teams?
Joshua Dobbs has been incredible. But for a seven-year veteran, this explosion in performance seems unlikely. Could the Vikings supporting cast be boosting his numbers?
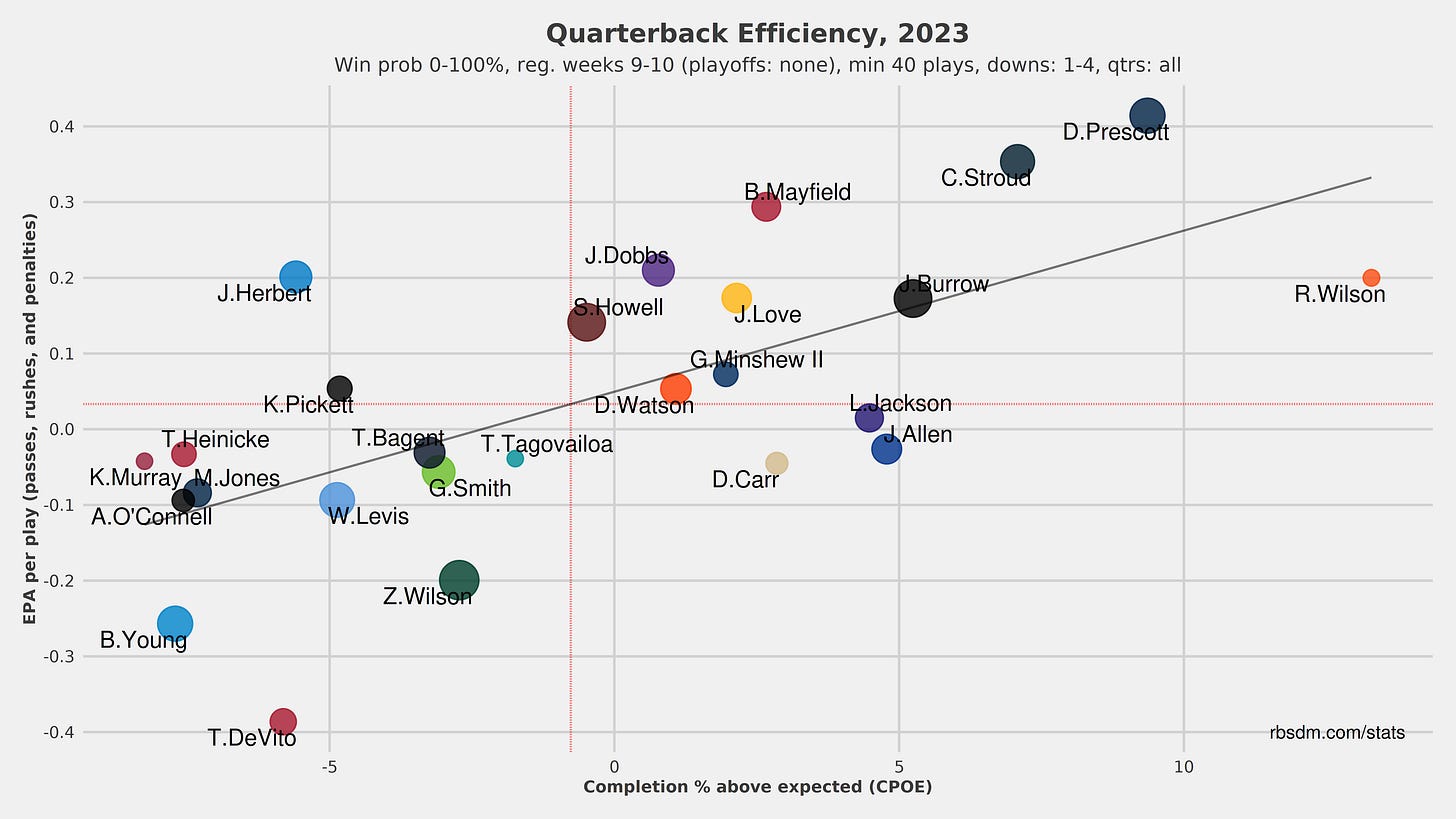
Joshua Dobbs has been on a tear, winning both of the games that he’s played significant snaps for and providing some magical moments along the way. His production is astounding; he ranks fourth in EPA per play among quarterbacks in the last two weeks.
Interestingly, he ranked 27th in a Cardinals uniform. Certainly, variance plays a role. But something else might be at play here.
One element of the Dobbs story has been the strength of the Vikings supporting cast. In contrast to Arizona, it certainly seems to be quite a bit better than what Dobbs experienced — the Cardinals’ leaders in receiving yards per game are Michael Wilson, Marquise Brown and Trey McBride. They rank 23rd in ESPN pass block win rate.
But how solid has Dobbs’ cast really been and to what degree can we point to that supporting cast as a reason for the difference in his success in Minnesota?
After all, Kirk Cousins hasn’t played in a game since Halloween and he still leads the league in dropped passes. He also leads the league in hits taken as a quarterback. And Dobbs doesn’t have Cousins’ top receiver available to him.
The Vikings offense was meant to be the strength of a playoff-bound team, but injuries to Kirk Cousins and Justin Jefferson – as well as a midseason move to change the interior offensive line after multiple injuries there – mean that the Vikings offense might not be quite the boon of talent we expected it to be.
On top of that, it might be fun to compare “supporting casts” across the league against each other.
Ranking the Supporting Casts
In this context, we’ll take a look at the pass blocking and receiving capabilities for each team to provide context for quarterbacks. That’s not to say that the playcaller, quarterback coach or running game doesn’t impact the passer – they unquestionably do.
But the bigger impact is on the pass protection unit and the receiving capabilities given to the quarterback. On top of that, they are easier to quantify.
I was inspired by a conversation I had on stream for Bleacher Report about the receiving corps around the league once Justin Jefferson comes back. Using the average yards per game of every team’s top three receivers (which is to say, I averaged an average), I found that the Vikings had the most productive top three receiving group.
This is perhaps the most bad-faith, generous method of collecting the data for the Vikings – it essentially does not account for the fact that T.J. Hockenson and Jordan Addison have seen their yards-per-game number skyrocket in response to Jefferson’s absence. Meanwhile, the Houston Texans are close behind with an almost entirely healthy receiving group all competing for targets at the same time.
There’s no perfect way to deal with this fact, but there are methods that are a bit fairer to the rest of the league. Unfortunately, there are more ways to go about this task than I have time for. We could, for example, attempt to assign a value to each player and then average out those values to find out who has the best supporting cast.
But we shouldn’t let one team make up ground with a superior fifth receiver if they have an inferior top receiver. So, to account for that, I’ll snap-weight the measures.
Total yards isn’t a very sophisticated way of looking at receivers either. Aside from the fact that it leads to the issue mentioned above where some yards have been substituted for others in Jefferson’s absence, it’s also pretty sensitive to how often teams throw the ball or how good the quarterback is. We should, to the best of our ability, separate the supporting cast scores from quarterback play.
So I gathered what are meant to be quarterback-independent grades for receivers and offensive linemen using Pro Football Focus, Sports Info Solutions and ESPN’s metrics.
Specifically, I used PFF receiving grades, SIS total receiving points and ESPN’s receiver ratings and used “routes run” as the weight on the receiving side and used PFF pass blocking grades, SIS total pass blocking points and ESPN’s pass block win rates on the pass blocking side, using pass block snaps as the weight.
I’ve detailed my issues with ESPN’s receiver scores before but it should at least help with this kind of exercise nevertheless.
I converted the grades, ratings or points each system produced into a snap-adjusted grade for the unit as a whole, normalized the grades so the scales were all similar, and came up with the following rankings.


