

FTN Fantasy Projects a Losing Season for the Vikings. Why?
FTN Fantasy, the spiritual successor to Football Outsiders released their yearly Almanac previewing every NFL team.

Being a sports fan is an exercise in being seen. It doesn’t take a sociologist to tell you that sports are a binding agent, bringing in people from wildly different backgrounds and uniting them in a common cause, creating a community built on shared experience, common goals and established dynamics.
That said, sociologists have done exactly that.
The trouble with this dynamic is that fanbases develop an internal language, a shared code and a mutual understanding of the quirks of their team that can be difficult for outsiders to fully understand or pierce.
The tradeoff between the insular act of community-building and seeing oneself reflected in the national conversation is a tradeoff that sports fans enthusiastically agree to, though it can lead to discontent with national coverage from reporters who don’t “get it.”
The good news is that Mike Tanier, who writes for his own Substack Too Deep Zone, seems to get it. He wrote the Vikings preview for the FTN Almanac, which was furnished to Wide Left as part of a partnership with FTN. In that Almanac, Tanier wrote:
The Vikings are topsy-turvy contrarians from Opposite Land. They have been that way for nearly a decade. When they are supposed to be great, they’re mediocre. When they are supposed to be mediocre, they win 13-plus games. When they’re rebuilding, they contend. When they are supposed to be contenders, they look like they need to rebuild. When a Vikings starting quarterback gets injured, the backup becomes a sensation. When the starter is healthy, he’s inevitably a mild disappointment.
The Vikings are avant garde artists whose preferred medium is football games decided by last-minute 50-yard field goals. They surf the crests of probability distribution curves, and they’re fueled by dilithium-crystal skepticism. As long as you think they are a fluke, they remain on a tear. But the moment you start to believe in them, they turn into Michigan J. Frog from that old Chuck Jones cartoon: they stop singing and dancing, making experts/bettors/fans look like nitwits for thinking that they ever could.
It really seems like he gets it.
But it’s a preview, not a catharsis. Let’s review Tanier’s work and get an understanding of how an outsider views the Vikings from the perspective of an analytics-forward company like FTN.
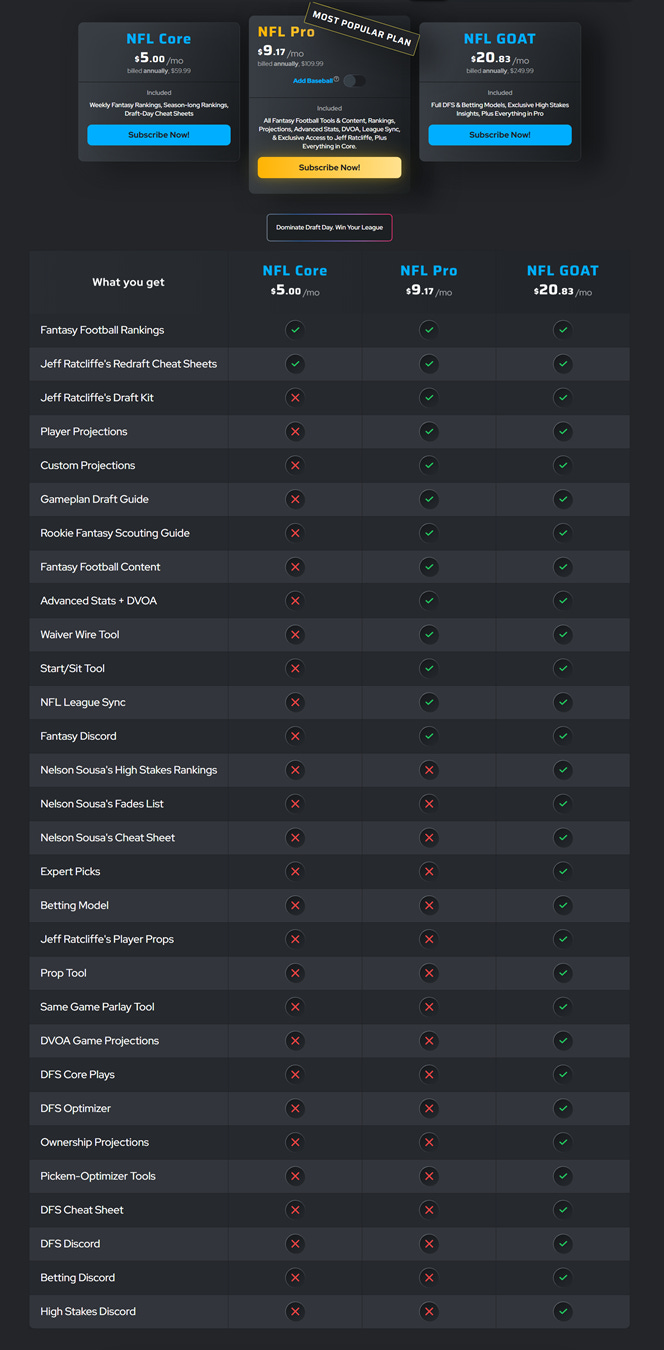
First, that partnership: Wide Left readers can access FTN’s deep database of football statistics, which not only includes DVOA, but also elements like blitz rate, coverage shells and air yards using discount code WIDELEFT10 for 10 percent off any of their subscription products, including NFL Pro and Stats Pro.
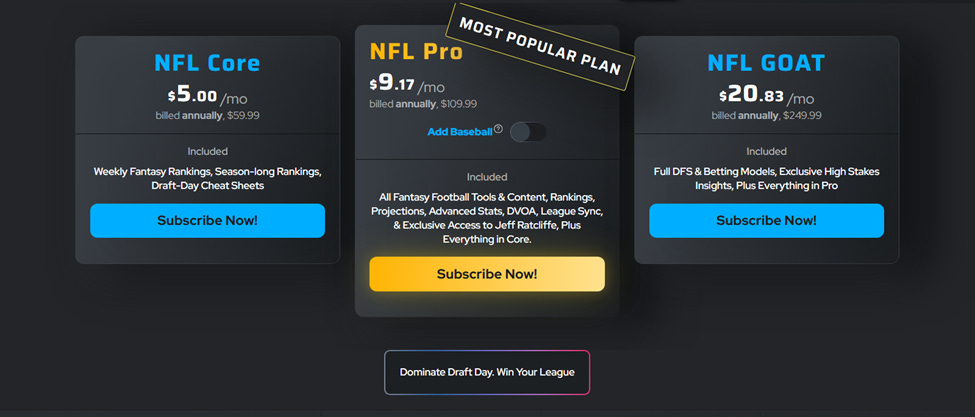
It’s worth it – I’ve paid for one ever since Aaron Schatz left Football Outsiders for FTN Fantasy – and I’m still paying for it.
But let’s talk about Tanier’s preview. It’s not optimistic. But what right does FTN have to be pessimistic about the Vikings?
DVOA, a proprietary metric explained in further detail below, is constantly being refined by Schatz. In that effort, it turns out it’s good at predicting year-over-year wins.
Even slight adjustments – weighting defensive, offensive and special teams DVOA separately – improve its ability to predict next year’s win percentage for teams over measures like yards per play, point differential, points per play, actual wins, first down rate and others.
In the Almanac, further adjustments are made to account for player movement, age, injury luck and so on. They have models for rookie passers, edge rushers and so on. They have models designed to predict the impact of a high-value free agent or roster turnover.
Tanier’s preview starts with the Vikings’ recent history of results – always contrary to expectations – to set up that he doesn’t necessarily want to fall into the same trap all of us fall into before he reveals that the Vikings are not well-respected by the projections produced by this analytics firm.
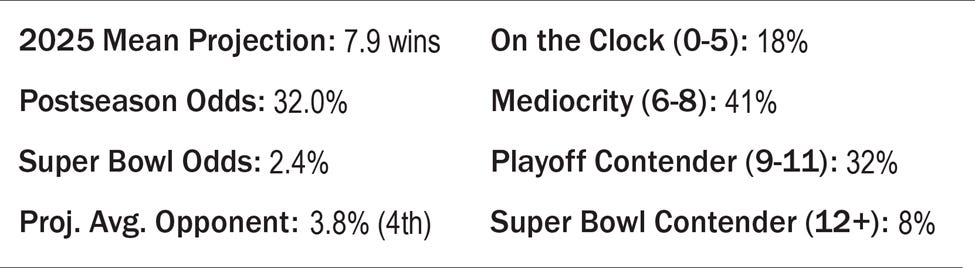
The Vikings have a projection under .500 with the most likely set of outcomes falling into the “mediocrity” bin. They only have a one-in-three chance of making the postseason. Last year, they were tied with the Super Bowl-winning Eagles for having the third-best record in the NFL.
What gives?
Uncertainty at Quarterback
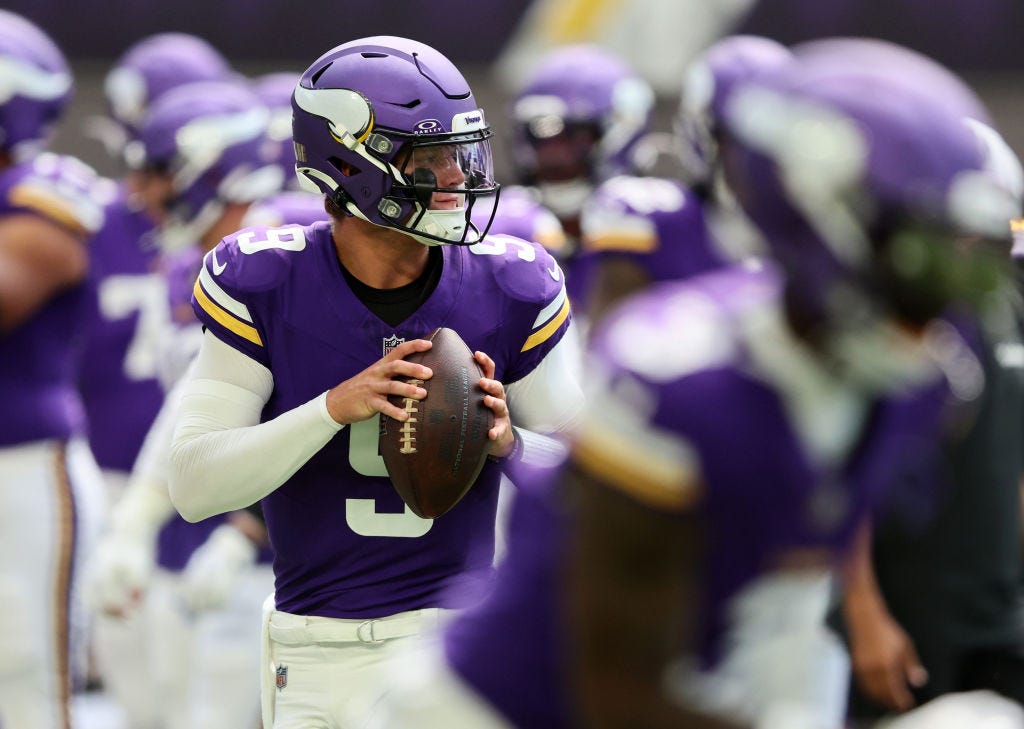
The most obvious factor here is the loss of Sam Darnold and the decision to ride with J.J. McCarthy. As Tanier explains, “Our projection system treats him as a first-round rookie, and very few rookies perform like Jayden Daniels. Our metrics don’t factor in any lingering injury impact, but they also don’t factor in quotes about how sharp McCarthy has looked in minicamp or how hard he worked in rehab, because such quotes are just fan-pleasing white noise.”
That’s reasonable for an analytics firm, but it is worth some interrogation. There are some sources for optimism outside of offseason quotes. The two primary elements that warrant optimism in McCarthy have little to do with our evaluation of him as a prospect – which we have – and more about the circumstances of his anointment.
Choosing Change
There are very few circumstances where a first-year player takes over for a successful quarterback, and the one that immediately springs to mind is Patrick Mahomes taking over for Alex Smith, coming off of Smith’s multiple Pro Bowl seasons and playoff appearances.
That’s not to say that McCarthy is Mahomes, but rather that a rookie or first-year quarterback taking over for a bad quarterback is different than one taking over for a good quarterback. In the first circumstance, one is forced to make the change regardless of how talented the first-year player is, whereas the second circumstance involves a team making a change because it wants to.
Is there anything to this? We can review Schatz’s history of his proprietary metrics to get a good understanding of that. Since the year 2000, there have been 89 quarterbacks who threw 200 or more passes in their first year in the FTN database.
The two metrics for which Schatz has become known, and which helped set Football Outsiders apart from a broad swath of independent football media entities in the early 2000s, are DVOA and DYAR.
DVOA stands for “Defense-adjusted Value Over Average,” though the “defense” generally means “opponent,” as one can use DVOA for defensive measures while adjusting for opposing offenses. Schatz describes DVOA on FTN as a metric that “measures a team’s efficiency by comparing success on every single play to a league average based on situation and opponent.”
There are explainers of varying degrees of sophistication and depth on the explainer page at FTN, but my interpretation of DVOA has always been as a metric that combines success rate and explosiveness into one number and then adjusts for opponent. It is expressed as a percentage and is a rate statistic that accounts for the number of plays or drives a team or player may have.
DYAR – Defense-adjusted Yards Above Replacement – is similar, except it’s primarily a volume statistic and is expressed as an integer (yards). This way, one can essentially determine the value of a player’s production while also accounting for usage.
A high DVOA and low DYAR for a player would suggest that a player is not being used often or missed several games, which means that the quality of play he put together could be high, but he wasn’t that valuable to his team.
These measures have their limitations, also highlighted by Schatz in the explainer, but many of the limitations are about the supporting cast and the intricacy of football when it comes to using production to explain player-level performance.
That’s an important caveat, but not as significant in this case because we’re getting as close as possible to evaluating like-for-like by looking at how well quarterbacks performed on the same team (with a slightly different supporting cast in a different year) on the same team.
Those 89 quarterbacks had to be reduced to 84 because there wasn’t enough data on prior passers. Generally, it was because the team they took over featured too many different quarterbacks in the prior year to have meaningful DYAR data. However, in some cases, it was because there was no prior quarterback; for instance, David Carr was the first quarterback the Houston Texans ever featured.
Of the 84 passers who took over for previous passers, we see that they typically replaced passers on teams who were below average, with the average rank of that team’s DYAR hovering around 23rd overall.
That makes sense: teams looking for a replacement aren’t usually doing so because things are going well. Many of these first-year quarterbacks were first-round picks for a reason.
Because there are more quarterbacks than teams, we can re-rank the quarterbacks within the realm of 32. That makes the comparisons a bit simpler without losing any of the meaning we’re looking for.
Those first-year passers have an adjusted rank of just 22nd, meaning that they haven’t done meaningfully better than the players they replaced. That’s just an average, of course. Mason Rudolph dropped Pittsburgh’s passing offense from sixth to 28th while C.J. Stroud elevated Houston’s passing offense to sixth from 30th.
Fifteen-plus rank improvements belong to first-year players: Stroud, Baker Mayfield, Dak Prescott, Jayden Daniels, Cam Newton, Jameis Winston, Deshaun Watson, Matt Ryan, Mac Jones and Russell Wilson.
So, what happens when a new quarterback takes over a top-10passing offense? Well, it’s better than when new quarterbacks take over mediocre passing offenses.
The average rank for a quarterback in that ideal situation is 18th overall. That makes sense; quarterbacks don’t own all of their production – they rely on the production of receivers, offensive linemen and the playcaller. Many of those won’t change coming off a successful season.
The worst quarterbacks in that high-passing offense group by DYAR are also quarterbacks whose teams were forced into the situation, much like replacing a bad quarterback. Rudolph took over for an injured Ben Roethlisberger, Jake Browning replaced an injured Joe Burrow and Davis Mills took over for an… absent Deshaun Watson.
The only other poor quarterback in that group, Ken Dorsey, was a seventh-round pick who replaced a departing Jeff Garcia. Every situation is a bit different, so it can be tough to parse situations like the Bengals’ decision to opt for Andy Dalton when they had the rights to Carson Palmer, a quarterback who threatened to retire if he wasn’t traded, but it seemingly was a choice the Bengals proactively made.
To see if there’s a meaningful difference in outcomes based on whether teams chose to replace a quarterback or were forced to for performance or retirement reasons, we can separate the first-year quarterbacks into two groups.
When prior-year quarterbacks go elsewhere in free agency or are released, like Philip Rivers in 2020 or Garcia in 2004, we’ll call that a team choice. We’ll also include situations like Palmer’s in that group, too.
These are judgment calls, but it at least gives us a first look at solid passing offenses where teams chose to move on. Because our sample becomes extremely small (five players who averaged 14th in DYAR), we’ll extend this to all offenses that ranked 15th or better to account for both sides of the Vikings’ eighth-ranked passing game in 2024.
That leaves us with 2004 Carson Palmer, 2004 Ken Dorsey, 2020 Justin Herbert, 2011 Andy Dalton, 2013 Case Keenum, 2006 Jason Campbell, 2006 Matt Leinart, 2023 Aiden O’Connell and 2006 Tony Romo.
With only three top-10seasons (Romo, Dalton and Herbert), that’s not a guarantee of success, but the average rank of 16th suggests that the choice to move on from a player instead of being forced to move on means we should raise our expectations for the first-year quarterback.
These offenses generally worsened with their new passers, but they didn’t decline as dramatically as offenses typically do when they are forced to play their first-year quarterback.
Quarterback Whisperer?
The second reason it may be a bit premature to ding the Vikings harshly for switching from Darnold to McCarthy is one that might be more difficult for an analytics outfit like FTN to account for: Kevin O’Connell.
This is anecdotal at best, but it is notable that 2023 was Joshua Dobbs’ best year by DVOA (he did not have enough pass attempts to qualify for DYAR in other seasons) up until that point – even though his other years were low-attempt years with high volatility that, by randomness, could have made a bad year look good.
Last year, of course, was Darnold’s best year by a good margin. Nick Mullens also had his two best DVOA years (again, a non-DYAR qualifier) with O’Connell.
On the other hand, Cousins’ injury-shortened year was (only) fifth in DVOA over his career. While it may be notable that his best DYAR and DVOA years were with Sean McVay as his coordinator – a high bar to clear – he still had two better seasons by DVOA and DYAR with the Vikings before O’Connell than either season with O’Connell.
Should a statistics-oriented outlet use small-sample evidence from luminaries like Mullens and Dobbs to give some credence to the reputation O’Connell has as a quarterback guru? Probably not. But that doesn’t mean fans are wrong to find it compelling.
With all the nitpicking about their projected performances, one might expect that the FTN projection for the Vikings in 2025 will be radically different from their actual performance in 2024. In reality, it’s exactly the same – 15th overall.
So, what is the end result of being down on McCarthy’s prospects? It likely means that the Vikings can’t take advantage of the improvements they’ve made along the offensive line or the expected growth we might see from Jordan Addison or the addition of a viable RB2.
The offensive line has an outside shot at being a top-three unit, which is something the Vikings have not had for quite some time. It’s not likely that they’ll end up in that group of elite performers, but it’s more likely than any other time in the previous decade.
With that in mind, it might make sense to think of the Vikings as knocking on the door as a top-10 offensive squad rather than one destined for mediocrity. Even if we ignore the reputation O’Connell has earned – fairly in my opinion – we can use a different set of quarterback assumptions and argue that the Vikings should be closer to 10th than 15th in offensive DVOA.
Defensive Disappointment
Regression on the Roam
A big part of Tanier’s argument is about the defense, not the offense. At the end of the day, he’s essentially arguing that the Vikings offense won’t move much. They ranked 15th in DVOA and 14th in EPA per play. They will, according to FTN’s Almanac, stay in the same region.
Instead, the second overall defense will drop from second to… 18th!
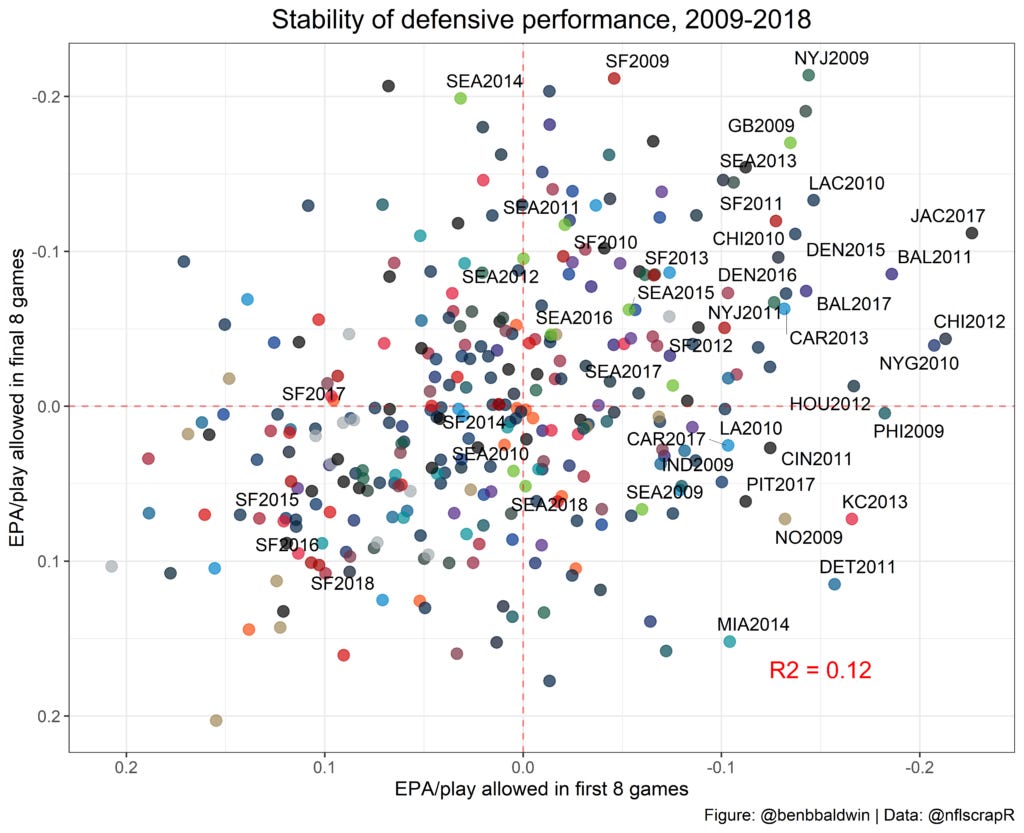
The primary reason Tanier brings up is the well-known understanding in analytic circles that defensive performance is more volatile than offensive performance from year to year. Another way to put it: offenses are better at repeating their performances the next year than defenses are.

This isn’t mere “common sense” – this analysis has been replicated in many ways, time and again, by different analysts using different approaches. Eric Eager found this to be the case at Pro Football Focus, Josh Hermsmeyer at FiveThirtyEight and Jim Armstrong at the now-defunct Football Outsiders, using DVOA data. Some of these studies look at year-to-year trends while others look at in-season trends, but the conclusion is the same: knowing how good a defense has been doesn’t give us much information about how good a defense will be.
Tyler Sarge’s master’s thesis at West Chester University found something else interesting: continuity at offensive coordinator had a strong positive relationship with win percentage, while continuity at defensive coordinator had a much weaker relationship.
The offensive coordinator relationship was stronger than the relationship to win percentage produced by continuity at all four primary coaching positions – head coach, defensive coordinator, offensive coordinator and special teams coordinator.
Defensive regression can be difficult to fully absorb for Vikings fans. The Flores-led Vikings ranked 11th in defensive DVOA in 2023 before improving to second last year, and the Zimmer-led Vikings had four consecutive years of top-five defenses. Why should we accept that defenses generally regress?
There’s a reason not to completely accept that defensive regression is likely.
Sarge’s analysis initially did not account for player continuity, strength of schedule or player salary. When accounting for those elements, all relationships lost statistical significance, which is another way of answering the question “what are the odds that we see this relationship emerge if everything were random instead of meaningful?”
However, defensive coordinators had the lowest “p” value of the three coaching positions when accounting for these variables, a significance value of 0.159, indicating that the odds that this positive relationship isn’t random hover around 84 percent.
That player continuity finding also speaks to something in Eager’s piece on the subject – defensive performance is more defined by the quality of the worst player on the field than the best player on the field.
Stability on offense has a lot to do with the quarterback, but there is no equally important position on defense. Instead, offenses identify weaknesses in the defense and exploit them, so reducing weaknesses improves performance.
The Vikings’ weakest links, by PFF grade, were Jerry Tillery, Jihad Ward and Jonathan Bullard. Outside of the defensive interior, the next-lowest graded players were Pat Jones II and Camryn Bynum.
They’re all gone.

It’s difficult to make the case that the Vikings necessarily upgraded at safety. Still, it seems pretty clear that they upgraded along the defensive interior with the additions of Jonathan Allen and Javon Hargrave. At the same time, the increased snap rotation for Dallas Turner should help resolve the concerns about losing Jones.
We’re fully in purple-colored glasses territory, but each of these optimistic steps seems reasonable.
The Zimmer detail was nagging at me, too. Perhaps it’s the case that bad defenses don’t stay bad as often as bad offenses do – but can good defenses stay good?
A look at the archive of FTN data tells us that they generally do. Top three defenses generally stay in the top 10 a third of the time – that’s more often than top three offenses showing up in the top ten the next year. Top three defenses also make an appearance in next year’s top five 40 percent of the time, too – again, better than top three offenses.
This was tested over a decade of FTN data, but it holds going back to 2000 as well. With the second-ranked defense last year, there’s a good chance that they’ll do a bit better than league average in the following year.
Brian Flores and Volatility
If the only argument for a slide in defensive performance that Tanier had was regression, then the Vikings would probably rank near 10th, not 18th. But there’s more to it than that.
The FTN Almanac notes that much of the defensive success came from Flores’ ability to produce turnovers, a measure that is notoriously volatile. Though an argument can be made that the Flores defense uniquely enables turnovers – something worth considering – it’s still fairly unlikely that the Vikings reproduce their league-leading turnover rate in 2025.
Tanier is correct to note that the approach is fairly boom-bust, but the Vikings were notably good in more stable statistics. Aside from the fact that DVOA, as a predictive statistic, is designed to mute the impact of turnovers, the Vikings were fourth in the NFL in play-to-play success rate and in DVOA on first and second down.
They were sixth in drive success rate – an FTN metric that measures how often opponents generate a first down or touchdown per new set of downs. They were also sixth in “points prevented” per drive, which is essentially an EPA statistic on the drive level.

When eliminating turnovers, they were the sixth-best team in opponent score percentage and opponent points per drive.
All of this is to say that turnovers weren’t the driving force of the defense; they simply supercharged it. Tanier also correctly notes that the Vikings had a surprisingly low pressure rate for their high blitz rate, suggesting that their proclivity to produce turnovers isn’t as easy to duplicate as one might think, given their poor pressure production.
But the fact that the Vikings forced the fourth-fastest time to throw in the NFL seems meaningful to this point. Few teams with high pressure rates also forced fast throws, and the Vikings were getting past offensive lines – they had the fourth-best pass rush win rate.
Quarterbacks were panicking and getting rid of the ball. That resulted in turnover production. There probably is something to their turnover efficacy that goes beyond mere pressures. That might be why they produced the second-fastest time to throw on non-pressured snaps, per FTN.
It’s not just that they produced turnovers. They also forced turnover-worthy throws. FTN determined that the Vikings ranked third-best in turnover-worthy throw rate overall and the second-highest rate of turnover-worthy throws on “quick” throws, as determined by FTN.
That might be why, though their approach looked risky, they only allowed the 13th-highest “highlight throw” rate, a measure from FTN’s army of play-by-play charters that measures how often a throw would be a “highlight” regardless of the receiver’s performance (or lack of performance) on the play.
OK, But He Has a Point
That said, there are some significant issues with the Vikings’ defense that could signal significant problems coming down the pike.
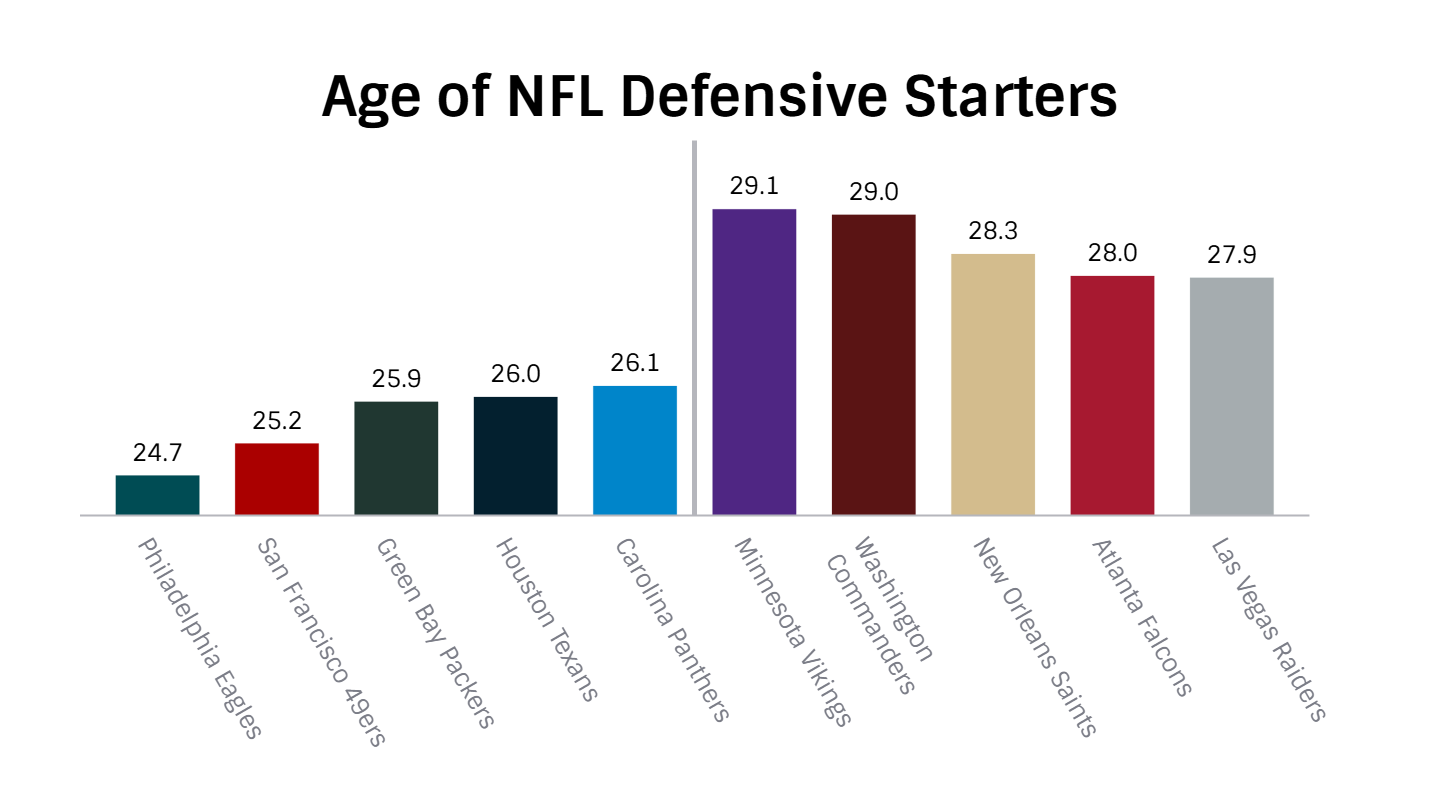
The first, and most obvious, is their age. The Vikings’ defense is likely to be the oldest in the NFL. Tanier doesn’t spend much time on this point, but it is well-received.
That, combined with the Vikings’ unusually good injury luck on defense last year (fourth-best in Adjusted Games Lost, a snap-weighted measurement of games lost due to injury), means there will almost certainly be off-field sources of regression.
It’s also relevant, as Tanier points out, that even if the Vikings replaced their worst performers, they could have introduced downgrades in performance in the secondary, filling it with fliers like Isaiah Rodgers, Mekhi Blackmon and Jeff Okudah.
One might imagine that one or two of these players are upgrades over Shaquill Griffin and Stephon Gilmore, but FTN is correct to point out that there’s not much reason to believe so aside from trust in small samples and faith in the coaching staff.
If one accepts Tanier’s broad argument about defensive regression, one well-founded by the data we generally use to project these elements, and combine that with worries about age and injury, it makes sense to put the Vikings below 16th overall.
Wait, What About Close Games?
If one were to project this year’s record off of last year’s record, it would make sense to discuss close games. The Vikings were, once again, close game mavens in 2024. In the O’Connell era, they have a win rate of over 70 percent in games that end within one score.
This isn’t necessarily relevant to a discussion about how to project the Vikings’ record based on DVOA. If we agree that the Vikings will be average on offense and below-average on defense, as FTN projects, then an eight-win projection makes sense regardless of how many wins they produced in 2024.
But Tanier brings it up because their DVOA projection would produce a number of close games, and Vikings fans have become proud of their close-game capability. He’s right to argue that close game record in one year tells us nothing about close game record in the next year.
Luke Braun's Film Room: What Is Real, And Are The Vikings For It?

If you’ve been a Vikings fan for a long time, you may have felt a strange, surreal comfort as Minnesota’s 31-29 win scrambled through the 2nd half. The Vikings watched their biggest ever lead at Lambeau Field slip away as Packers fans shook the building’s old bones to their core. We, as fans, thought, “here we go again.”
The only issue with this approach is that it is imprecise. It lumps together games that were legitimately one drive away from flipping and games where the score happened to end up close because the leading team allowed the trailing team to soak up the clock on a meaningless, end-of-game scoring drive.
I explored this phenomenon last year when discussing how it impacted the Vikings, using end-of-game win probability instead of the score to account for this problem. The vast majority of teams with a notable close-game record do not experience any meaningfully disproportionate rate of “true” close games or “false” close games.
But the Vikings did. While Tanier brings up some of these games in his examples – the Packers win in Week 4 is a good one – the Vikings never actually fell below 80 percent win probability since halfway through the second quarter, even though the Packers managed to come within one score twice in the fourth quarter.
About one-third of one-score games do not feature a team within 30 to 70 percent win probability with five minutes remaining in the fourth quarter. When looking at games where win probability was within that window at exactly the five-minute mark, the Vikings were 1-1.
That’s not to say we can ignore the overtime game against the Bears – one where the Vikings didn’t cross the 70 percent win probability threshold until there were zeroes on the clock – but the 50 percent odds of winning in overtime are baked into the 96 percent odds they had of winning the game at the five-minute mark.
For context, the ever-blessed Chiefs were 5-0 in these 30-70 games, the best record in the NFL.
The Vikings end up in one-score games more because they pull incredible leads – something else Tanier noted – and then allow opponents to drain the clock. They may have been a bit too cavalier about that process, as the Bears game (and as Tanier mentions, the Jets game) demonstrates, but the ability to get out into a lead in the first place is more sustainable than the collapse that occasionally followed.
The Vikings had the second-best average lead in the NFL, perhaps also a notable statistic when discussing how sustainable performance last year was.
So, can we be bullish on the Vikings despite this preview? It’s well-reasoned, and there are good arguments to project a significant step back for Minnesota. But, as we dive into the related questions Tanier brings up, we can convince ourselves, as any good fanbase might, that the Vikings might have more underneath the surface.
The vast majority of the statistics used in this piece were a product of data and advanced filtering provided through the FTN Fantasy StatsHub, including DVOA, DYAR, the data about time to throw, pressure rate, scoring rate, turnover rate, blitz rate, quick-throw rate, turnover-worthy play rate and more.
Readers of Wide Left can use the code WIDELEFT10 to get ten percent off a subscription with FTN Fantasy and access the stats used in this piece, along with a host of others, including coverage shells, coverage types, open rate, drop rate, and others.
BLAME AARON. HE MAKES THE PROJECTIONS. I AM BUT A MERE MOUTHPIECE. I WOULD HAVE PROJECTED 19 WINS IF IT WERE UP TO ME. HONEST! SKOL! :)
(Great piece! I have learned to trust the projections when they spit out stuff that looks odd.)