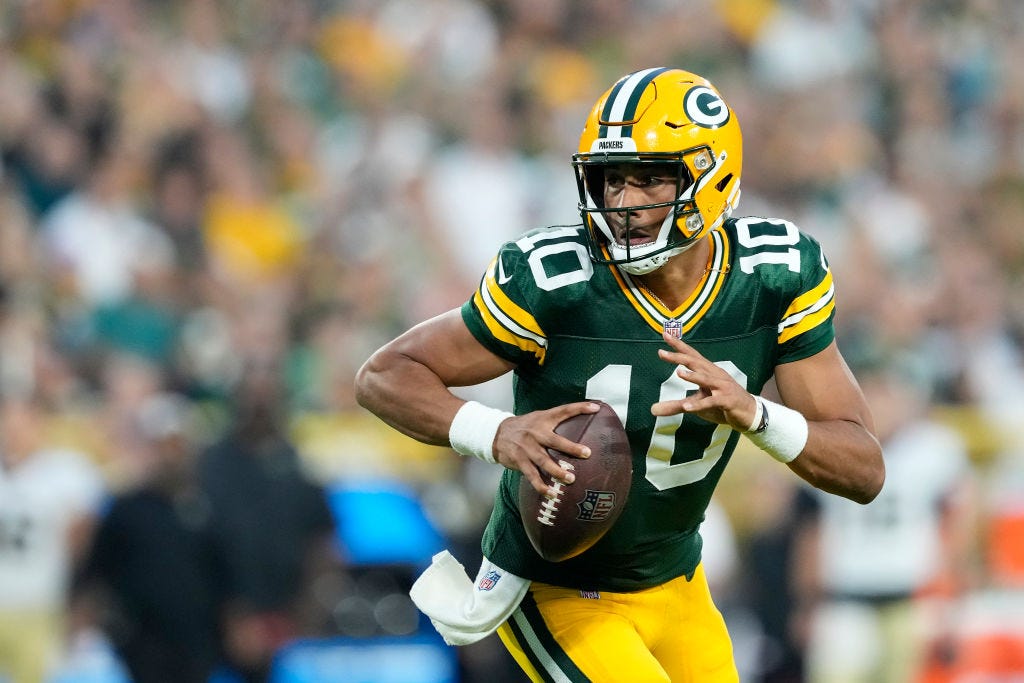
How Good is Jordan Love?
Jordan Love had a tremendous finish to the 2023 season. How much can that tell us about how good the Packers quarterback actually is?
On a recent episode of the Purple Insider podcast, I joined Matthew Coller to rank teams by their two-year windows – a way to put the Vikings’ decision to draft and develop a quarterback in better context than the one-year timespan we typically evaluate teams by.
In that appearance, I expressed skepticism about Jordan Love’s trajectory with reference to issues regarding his season-long splits, style of play and small sample size. Does that stand up to scrutiny?
The Packers are steeped in uncertainty – in addition to the prospect of Love regressing after an impressive late-season run into the playoffs, the Packers have hired a new defensive coordinator and have an offensive line in a state of flux.
It’s not just an idle question for fans. Love’s contract voids after the 2024 season and the Packers will have to make a decision about whether they want to extend him now and potentially save some money or allow him to show out and command a tremendous market price.
Nevertheless, those prospects have propelled the Packers to second-place odds in the NFC North, with a win total estimate of 9.5 in most sports books, with unfavorable odds for the over. One sportsbook even has them at 10.5.
But how good is Jordan Love? And can we tell?
“Sustainable Metrics” and Jordan Love
There are a number of statistics we can use that help us cut through the noise. Many of them are outlined in my piece on J.J. McCarthy, which details the difference between highly impactful production statistics and sustainable metrics that predict future performance.
There are a lot of ways to break down the statistical production of a quarterback, but it’s important to separate the kinds of production that project well to future success and the kinds of production that can operate as red herrings.
A very good example of this is third-down success rate. McCarthy is, statistically, the best quarterback in the class at converting third-and-long through the air. All of the available evidence suggests to us that this rarely translates season-to-season or, especially, from one level to the next.
Unfortunately, many of the most unstable statistics we have access to are also the most exciting.
…
In essence, we’re looking at the half-court shots these quarterbacks are taking and assuming that they’ll translate. It’s explosive, impactful and fun – but it doesn’t tell us very much about their eventual success in the NFL.
In short, being good at volatile metrics isn’t a bad thing but it can trick the viewer. For the Packers – and the rest of the NFC North – the question is whether or not Love falls into the category of quarterback where his highlights can mislead viewers into thinking he’s a higher-quality quarterback than he is.
We can take a look at the splits between his season-long performances in sustainable metrics like CPOE and production metrics like big play rate.
Top-eight performances are marked in green, while bottom-eight performances are marked in red.
Generally speaking, Love didn’t do wonderfully in terms of stable prediction metrics. Success rate refers to the percentage of plays where a player earned 0.00 or better EPA. CPOE is “completion percentage over expected,” which looks at how much better that quarterback’s completion percentage is than a typical quarterback in the same situation.
RBSDM’s CPOE measure looks at depth of target and the general direction of the throw. Next Gen Stat’s measure looks at those but also other factors like pressure, distance of nearest defender to the target and the distance of the target to the sideline.
One can also use depth of target and CPOE to estimate the YPA that a quarterback should be generating after accounting for those factors, which is what would happen absent outlier plays. That’s what the estimated YPA is meant to do.
For the other columns, Pro Football Focus has found that plays from a clean pocket, plays without play-action and plays on first and second down correlate much more to future performance – of all types – than the opposite. The “standard dropback” combines all three of those conditions.
PFF also found that quarterbacks more consistently avoid negatives than produce positives.
On the other side of the table are unsustainable statistics that tend to have a big impact or stick in our minds. Most of the time, they are opposite their counterparts in the table, but that wasn’t always possible. For the most part, big plays and production measures like EPA are sensitive to outlier events – vacated blocks, recovered fumbles, etc.
That’s not to say that traits like pocket presence or third down awareness are not contained within the skillset of the player, but rather that our ability to measure it in a consistent way is limited.
Nevertheless, the full-season view tells us something: Jordan Love’s perception could be boosted by an artificially appealing profile. That’s good news for the NFC North – if he’s a top-five quarterback by EPA per play, there’s not much stopping the Packers from overcoming the Lions and taking the division year after year.
Still, it’s not as if he’s secretly a bad quarterback – most of these metrics suggest he is probably an average quarterback. With the investments Green Bay has made along the defense and the offensive line, as well as a developing receiver corps, that could itself propel them to divisional contention.
But there is a bit of an issue here. Love was a much different quarterback in the first half of the season than he was in the second half. Does that matter?


